 ssok Launcher
 ssokEdit
 ssokIQ
 ssokCLI
 ssokMusic Free
 ssok Keyword Extractor
 ssokPlayer
 ssokKit
 SsokRecorder
Math Explainer Pack (Free)
A ssokEdit production pack that turns a one-line topic into a video explaining math and science concepts, with computed graphs and equations written out line by line
Free
1-year license from the payment date · 1 PC(s) · Seller: Strokehub Co., Ltd.
Signed-in members can download this for free. Import the pack file (.ssokpack) in ssokEdit → Pack Manager → "Import pack file", or install it directly from Pack Manager → Market packs.
Enter a single topic line and get a video that explains math and science concepts with computed graphs and equations written out line by line.
The AI doesn't draw the pictures. It only writes the equations and ranges, and the graphs are plotted by actually computing those equations. That way, the shape of each curve always matches its equation.
- Function graphs — Curves are drawn left to right on labeled coordinate axes. Up to three functions. Discontinuous functions like tan and 1/x break exactly where they should
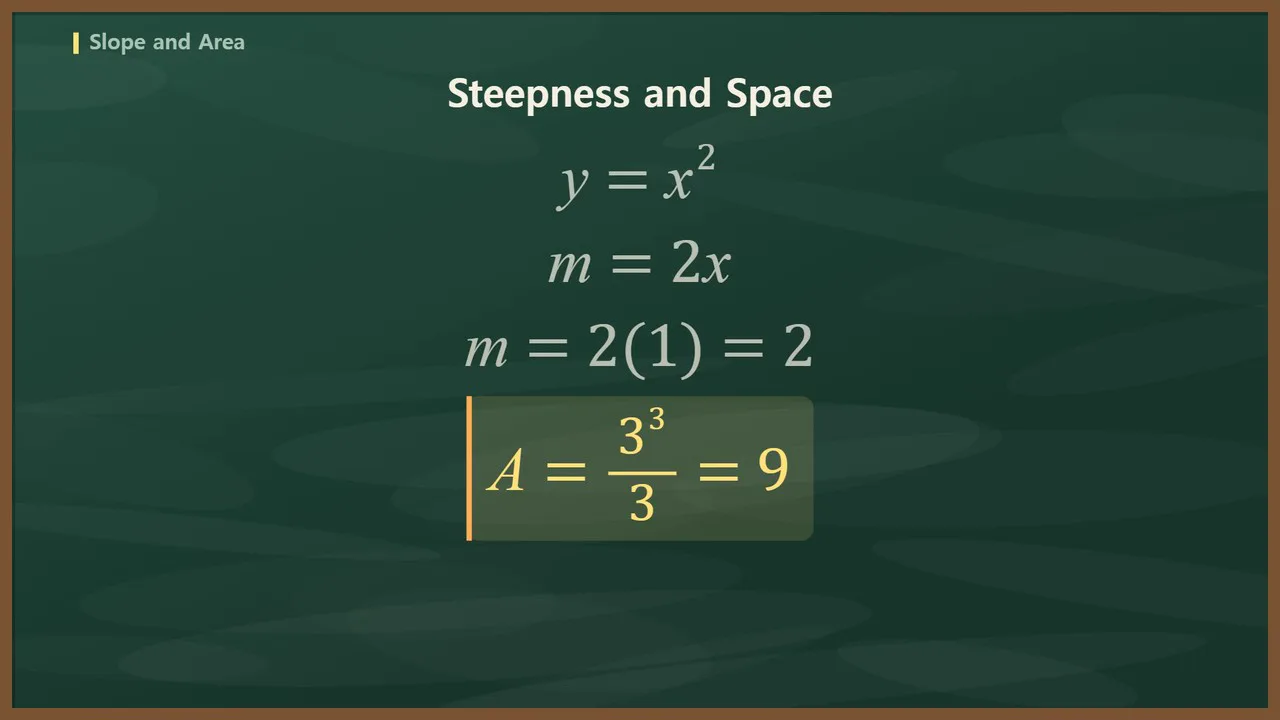
- Points · tangents · areas — Point coordinates, tangent slopes and the area under a curve are computed from the equation and shown on screen
- Equations line by line — Powers, subscripts, radicals and fractions are rendered as proper math notation, and the line being explained is highlighted
- Unit circle — As the angle rotates, the cos and sin values update. Angles like 30° · 45° · 60° also show exact values (√3/2)
- Number line — Positions of numbers, intervals, open and closed endpoints
- Building on a graph — Points, tangents and areas are added one at a time to the same graph. Anything already drawn isn't redrawn
- Three themes — Chalkboard green · Dark · Paper. Landscape and portrait
- The result lands on the timeline with the explainer video, narration and subtitles on separate tracks, ready to edit
Options when you run it
- Concept to explain — e.g. The graph of the quadratic function y = x² and the slope of its tangent
- Level — Middle school / High school / General audience
- On-screen title · color scheme
- Length — 60 seconds by default
Good to know
- Graphs, coordinates, slopes and areas are computed values. However, the choice of equations and the narration are written by AI and may contain mistakes. If you use it for teaching or exam prep, please check the explanations yourself.
- Areas and slopes are numerical calculations, shown as approximations to three decimal places.
- It can draw graphs of functions of x, equations, the unit circle and number lines. Geometric figures, tables and 3D graphs are not supported.
- The narration reads equations out in words. Depending on the voice, some readings may sound awkward, so please fix them on the timeline.
- If you choose English as the language in the run window, an English video is created. The AI-written title, subheadings and narration, as well as fixed on-screen labels (「넓이」 → Area, 「정적분」 → Integral, 「기울기」 → Slope), all appear in English.
Requirements
- ssokEdit 1.3.2 or later (Windows)
- Microsoft Edge (included with Windows) — used to capture the screen