 ssok Launcher
 ssokEdit
 ssokIQ
 ssokCLI
 ssokMusic Free
 ssok Keyword Extractor
 ssokPlayer
 ssokKit
 SsokRecorder
Bar Chart Race Production Pack (Free)
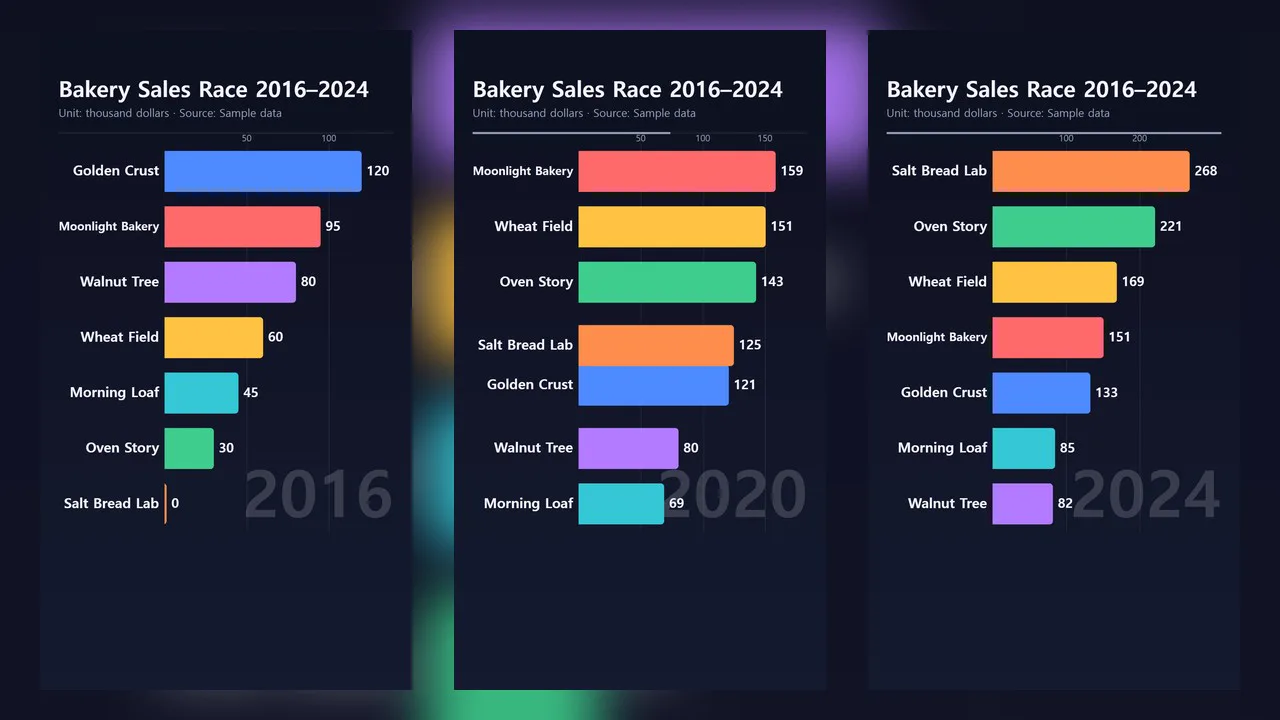
A ssokEdit production pack that turns a yearly data table into a bar chart race video, with commentary timed to the moments the lead changes hands.
Free
1-year license from the payment date · 1 PC(s) · Seller: Strokehub Co., Ltd.
Signed-in members can download this for free. Import the pack file (.ssokpack) in ssokEdit → Pack Manager → "Import pack file", or install it directly from Pack Manager → Market packs.
Feed in a table of yearly values and get a ranking race video where bars grow and overtake each other, complete with commentary timed to the moments the lead changes hands.
Just copy and paste a table from Excel, or enter the path to a CSV file. The numbers are drawn exactly as you provide them; the AI never invents or alters any figures.
- Charts that show every overtake: bars glide into new positions as values tick up in real time
- Commentary drawn from your data: the app finds lead changes, entries into the top 3, and the biggest gainers in your data, then times the narration to those moments
- Three table layouts: reads tables with periods as rows, tables with items as rows, and long three-column tables (period · name · value)
- Vertical or horizontal: choose 9:16 for Shorts or 16:9
- English videos: select English in the run window to produce on-screen text, commentary and voice in English. Axis labels are shortened to K · M · B, and currency symbols such as $ and € are placed before the numbers
- The result lands on the timeline as separate chart video, narration and subtitle tracks, so you can edit it right away
How to enter your data
연도,가나다 빵집,달빛 제과,밀밭,오븐 스토리
2020,120,90,60,30
2021,135,110,95,70
2022,128,150,140,115- The first row holds item names; the first column holds periods (year · quarter · month)
- You need at least 3 items and at least 2 periods. If there are more than 40 items, only the 40 with the largest values are used
- Values between periods are connected with straight-line interpolation. Blank cells are treated as 0
Options when running
- What is being ranked: e.g. changes in population ranking by country
- Data (table): required
- Unit · data source · on-screen title: optional
- Number of bars: 8 / 10 / 12
- Sound: with commentary / no sound
- Color theme: dark / light
- Length: 45 seconds by default
Good to know
- The commentary only describes ranking changes found in your data. It does not explain why they happened.
- Please verify the accuracy of your data and whether the source needs to be credited.
- Images such as flags or logos are not included.
Requirements
- ssokEdit 1.3.2 or later (Windows)
- Microsoft Edge (included with Windows by default), used to render the chart