 ssok Launcher
 ssokEdit
 ssokIQ
 ssokCLI
 ssokMusic Free
 ssok Keyword Extractor
 ssokPlayer
 ssokKit
 SsokRecorder
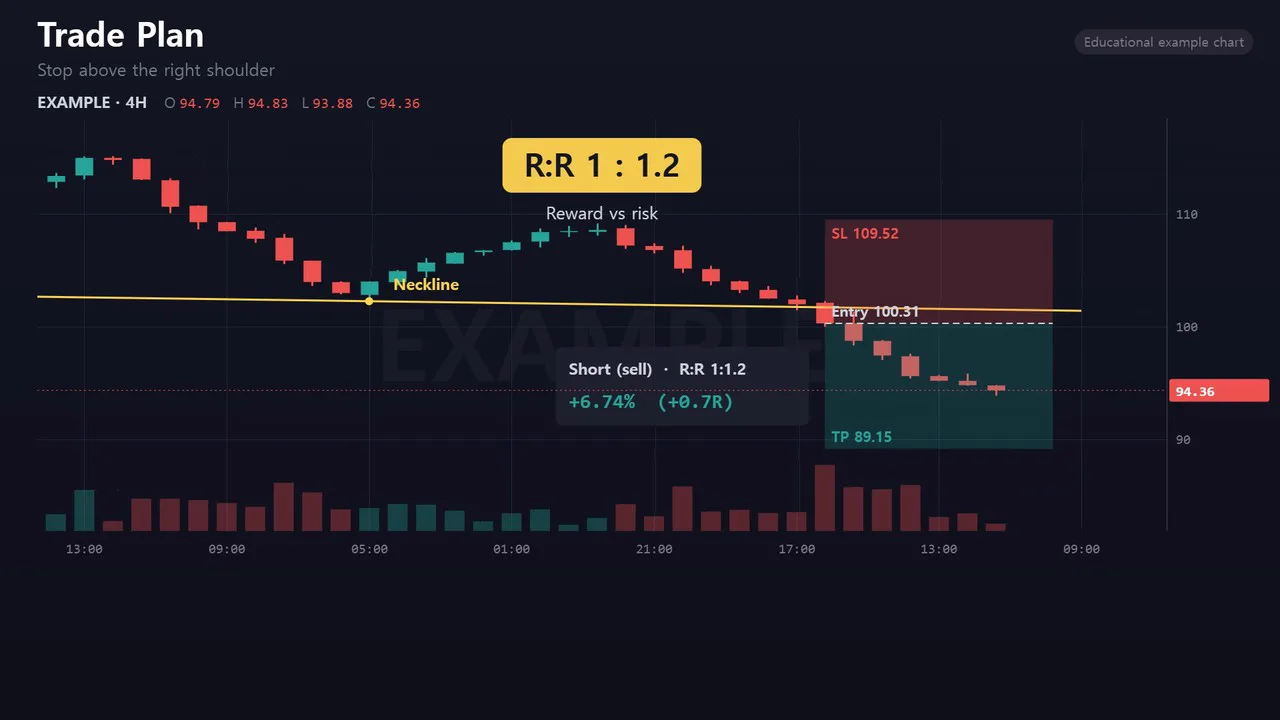
Chart Explainer Production Pack (Free)
A ssokEdit production pack that explains chart patterns, indicators and ICT concepts on a trading screen where candles are drawn live (based on ufvg's tradeanim)
Free
1-year license from the payment date · 1 PC(s) · Seller: Strokehub Co., Ltd.
Signed-in members can download this for free. Import the pack file (.ssokpack) in ssokEdit → Pack Manager → "Import pack file", or install it directly from Pack Manager → Market packs.
Just enter the chart concept you want to explain, and you get a lesson video where candles are drawn one by one on a trading-app-style candlestick chart, with trendlines, moving averages, patterns, FVGs, and entry/stop/target levels appearing in sync with the narration.
The AI designs an example chart that best illustrates the concept (pattern, phases, noise), then calculates highs, lows, and indicators from those actual candles before drawing them. That's why lines and boxes snap precisely to the candles.
- Indicators — Moving averages (SMA · EMA) · golden/death cross · Bollinger Bands · RSI · MACD · VWAP · volume
- Patterns — Head and shoulders · inverse head and shoulders · double top · double bottom · triangle · flag · cup and handle · breakout · fakeout
- ICT concepts — FVG · order blocks · BOS · CHoCH · liquidity (BSL · SSL) · premium/discount · Fibonacci
- Trade boxes — Entry, stop, target, and risk-reward ratio; P&L (R) updates in real time as candles are drawn
- The result is placed on the timeline as separate scene video, narration, and subtitle tracks, so you can edit it right away.
Options when running
- Concept to explain — e.g., head and shoulders, golden cross, RSI divergence, FVG, placing a stop loss
- Chart theme — Dark / Light
- Length — 90 seconds by default (30 seconds to several minutes)
- Language — Choose English in the creation window to make a fully English video, including narration, on-screen text, and chart labels (entry, stop, target, O/H/L/C, and the "Educational example chart" label)
Please note
- The chart on screen is an educational example chart (always labeled on screen). It does not show real market prices and is not investment advice.
How to get it
- Log in to ssok.ai and click "Get Production Pack (Free)" above.
- In ssokEdit, go to Production Pack Manager → Market Packs and install it directly, or add the downloaded
.ssokpackvia "Import Production Pack File". - On the start screen, choose "Create with Production Pack", select this pack, and enter your concept.
Requirements
- ssokEdit 1.3.2 or later (Windows)
- Claude connected (install and log in under AI Settings) — Claude writes the scene code
- Microsoft Edge (preinstalled on Windows) — used to render the scenes
Credits
This production pack reimplements the candle animation, indicators, and ICT annotation approach of ufvg's open-source tradeanim (github.com/ufvg/tradeanim, MIT) for the ssokEdit engine. Videos made with this pack belong to their creators, and no attribution is required.