 ssok Launcher
 ssokEdit
 ssokIQ
 ssokCLI
 ssokMusic Free
 ssok Keyword Extractor
 ssokPlayer
 ssokKit
 SsokRecorder
ssokEdit Production Packs
Chart Animation Pack (Free)
A ssokEdit production pack that turns your table into a chart video, drawing line, bar or pie charts and pointing out the key moments
Free
1-year license from the payment date · 1 PC(s) · Seller: Strokehub Co., Ltd.
Signed-in members can download this for free. Import the pack file (.ssokpack) in ssokEdit → Pack Manager → "Import pack file", or install it directly from Pack Manager → Market packs.
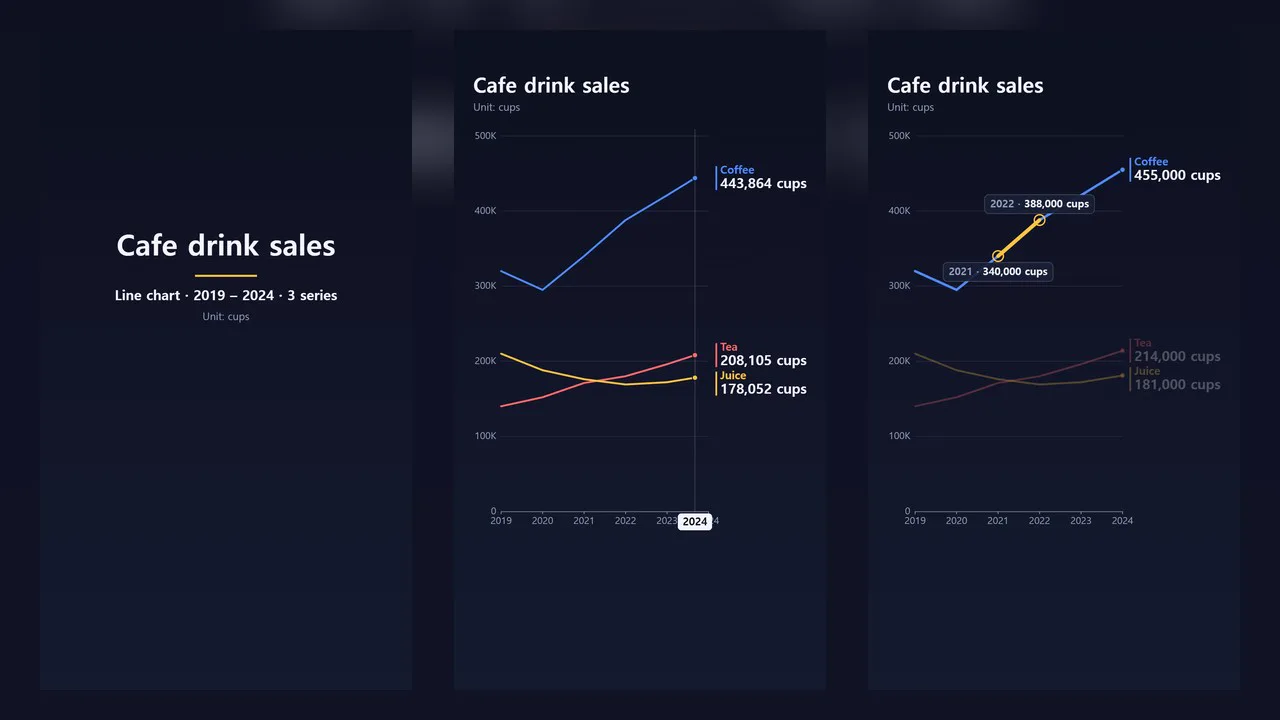
Feed in your own table and get a chart video that draws line, bar, or pie charts and walks through the key points one by one.
Numbers come only from the data you provide. The AI writes just the narration sentences; any line containing a number not in your data is discarded and replaced with a sentence the app builds from the data.
- Four chart types — line · bar · grouped bar · pie. On 「Auto」 it picks based on the table's shape (consecutive periods → line, a single item → bar …)
- Key points highlighted — the app picks 1–3 from the data among the highest · lowest values, biggest rise · drop, gap between series, and the final value, and reveals them in turn
- Entering a table — copy from Excel and paste it straight in, or type a CSV file path. Numbers like 1,234 · 12.5% · -30 are recognized
- Unit · source — shown in small text at the top of the screen
- Three themes — dark · light · newspaper. Portrait and landscape
- English videos — choose English in the run window to produce on-screen text, narration, and voice in English. Large numbers are shortened to K · M · B, and currency symbols like $ · € go before the number
- The result lands on the timeline with the chart video, narration, and subtitles as separate tracks, ready to edit right away
Options when running
- Topic — e.g. My shop's drink sales over 6 years
- Data (table) — first row: series names; first column: period or item names
- Chart — Auto / Line / Bar / Grouped bar / Pie
- Bar order — table order / largest first
- Unit · source · on-screen title (optional)
- Sound — with narration / silent
- Length — 30 seconds by default (12 seconds – 3 minutes). Runs a bit longer if the narration is long
Sample table
연도,커피,차,주스
2022,388,180,169
2023,421,196,172
2024,455,214,181
Good to know
- Line charts support up to 6 series, grouped bars 4 series, bars 12 items, and pies 8 slices. Beyond that, only the largest values are kept, and this is noted in the result summary.
- Pie chart percentages are calculated from your values. No other numbers are generated.
- Please cite the source when using someone else's statistics.
- Narration sentences are written by AI. Numbers are filtered, but please listen yourself and fix the nuance of the wording.
Requirements
- ssokEdit 1.3.2 or later (Windows)
- A brain AI connection — one of Claude · Codex · Gemini (not needed if silent and you enter the title yourself)
- Microsoft Edge (included with Windows) — used to capture the screen